Work with Product Observability
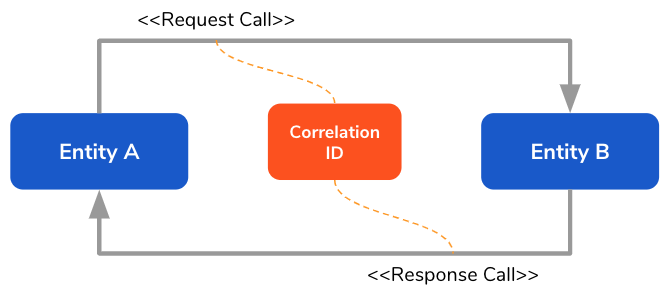
Product observability enables rapid debugging of product issues. WSO2 Identity Server (WSO2 IS) facilitates product observability by logging the time taken for LDAP and JDBC database calls. This helps to track down any latencies caused by database calls in an instance. The request calls and response calls are correlated via a correlation ID that is sent in the request call.
Note
By default, product observability is not enabled as it impacts on the product's performance.
Configure product observability
log4j configs
Follow the steps below to set up the correlation logs related to the database calls.
Following are the default correlation appender configuration. You can change any of these values using the log4j2.properties file in the <IS_HOME>/repository/conf directory.
``` toml
appender.CORRELATION.type = RollingFile
appender.CORRELATION.name = CORRELATION
appender.CORRELATION.fileName =${sys:carbon.home}/repository/logs/correlation.log
appender.CORRELATION.filePattern =${sys:carbon.home}/repository/logs/correlation-%d{MM-dd-yyyy}.log
appender.CORRELATION.layout.type = PatternLayout
appender.CORRELATION.layout.pattern = %d{yyyy-MM-dd HH:mm:ss,SSS}|%X{Correlation-ID}|%t|%mm%n
appender.CORRELATION.policies.type = Policies
appender.CORRELATION.policies.time.type = TimeBasedTriggeringPolicy
appender.CORRELATION.policies.time.interval = 1
appender.CORRELATION.policies.time.modulate = true
appender.CORRELATION.policies.size.type = SizeBasedTriggeringPolicy
appender.CORRELATION.policies.size.size=10MB
appender.CORRELATION.strategy.type = DefaultRolloverStrategy
appender.CORRELATION.strategy.max = 20
appender.CORRELATION.filter.threshold.type = ThresholdFilter
appender.CORRELATION.filter.threshold.level = INFO
```
Enable observability
Follow the steps below to enable product observability.
-
Navigate to the
<IS_HOME>/bindirectory on the command prompt. -
To set the
-DenableCorrelationLogsproperty totrue, execute the following command.Note
By default, this property is set to
false. -
Navigate to the
<IS_HOME>/repository/logsdirectory.Notice that a separate log file called
correlation.logis created.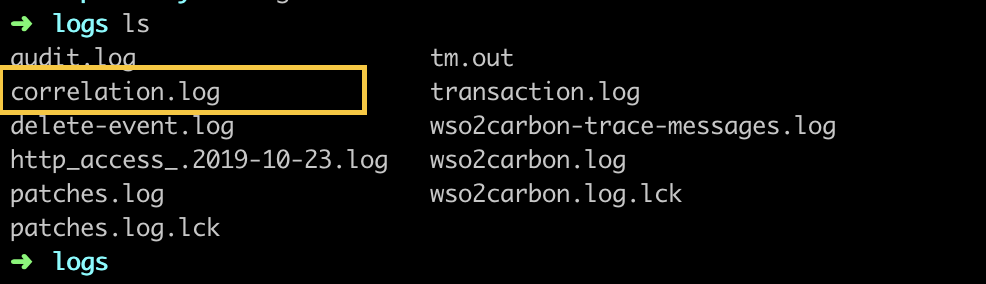
Now you are ready to test the product observability of WSO2 IS.
Tip
In order to test product observability, make sure you create a service provider and generate a client key and client secret, with which you can perform a secure database call.
Log patterns
Following are the log patterns that support product observability.
JDBC database call logging
2018-10-22 17:54:46,869|cf57a4a6-3ba7-46aa-8a2b-f02089d0172c|http-nio-9443-exec-2|4|jdbc|1540211086865|executeQuery|SELECT ID, TENANT_ID, IDP_ID, PROVISIONING_CONNECTOR_TYPE, IS_ENABLED, IS_BLOCKING FROM IDP_PROVISIONING_CONFIG WHERE IDP_ID=?|jdbc:mysql://localhost:13306/apimgtdb?autoReconnect=true&useSSL=false
LDAP database call logging
Beginning of the request call
Ending of the request call
Read the logs
Let's analyze the following sample log lines to find if there are any timing delays for the JDBC or LDAP calls.
|
|
Advanced scenarios
Following are a few advanced scenarios that are related to product observability in WSO2 IS.
Define denylists for the threads
Certain threads continuously print unnecessary logs. Defining denylists prevents the unwanted threads from printing logs thereby improving the readability of the logs.
Follow the steps below to configure denylists for threads.
-
Open either of the following files in the
<IS_HOME>/bindirectory on a command prompt.- For macOS/Linux:
wso2server.shfile - For Windows:
wso2server.batfile
- For macOS/Linux:
-
Add the following configuration as a system property.
Tip
Make sure to add it before the
org.wso2.carbon.bootstrap.Bootstrap $*line.Note
This configuration is not required by default, as all unnecessary threads are already a part of the denylist in the
MessageDeliveryTaskThreadPoolthread. If the above configuration is added, the default value will be overridden. -
Restart the WSO2 IS server.
-
To send the authentication request, execute the following cURL command.
curl -v -k -X POST --basic -u <CLIENT_KEY>:<CLIENT_SECRET> -H "Content-Type: application/x-www-form-urlencoded;charset=UTF-8" -H "customHeader1:correlationvalue1" -H "customHeader2:correlationvalue2" -d "grant_type=client_credentials" https://localhost:9443/oauth2/tokenTip
Use the
client keyandclient secretof the service provider you created after enabling product observability. -
Open the
correlation.logon a command prompt and notice the related logs.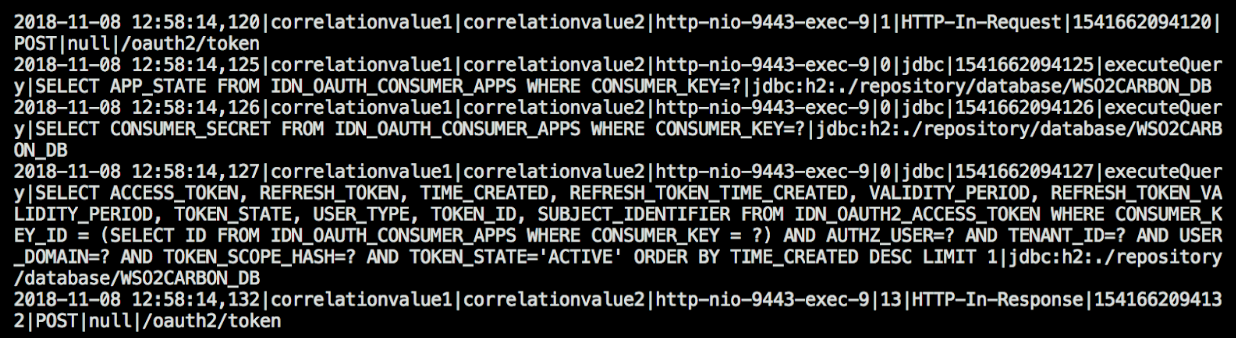
Customize JDBC database call logging
You can customize the log pattern for JDBC database call logging by specifying which fields should be included in the logs. This is done by passing the org.wso2.CorrelationLogInterceptor.JdbcLogFields system property when starting the server.
The following table lists the fields that can be included:
| Field Name | Description |
|---|---|
METHOD_NAME |
Method name of the database call |
QUERY |
Executed database query |
CONNECTION_URL |
Database connection URL |
DATABASE_NAME |
Name of the database |
To customize the JDBC log pattern, execute a command similar to the following example when starting the server:
You can include any combination of the available fields based on your requirements.
OpenTelemetry-based tracing in WSO2 Identity Server
Attaching a Java observability agent, such as the Datadog Java Agent, enables WSO2 Identity Server to automatically trace common operations, including API calls and database interactions. The agent’s built-in auto instrumentation generates these traces.
To provide even more comprehensive observability, WSO2 Identity Server offers explicit OpenTelemetry-based instrumentation for Lightweight Directory Protocol (LDAP) operations, such as search, bind, and lookup. Enabling this feature extends visibility to LDAP calls alongside other automatically traced operations.
The following sections explain how to configure tracing with the Datadog Java Agent. Once you attach and configure the agent, you can enable instrumentation for LDAP through the WSO2 Identity Server configuration.
Configure the Datadog Java Agent
To set up tracing with the Datadog Java Agent you need the following components:
- The Datadog Java Agent (
dd-java-agent.jar) attached to the WSO2 Identity Server Java Virtual Machine. - A running Datadog Agent that receives spans from the Java Agent and forwards them to the Datadog platform.
To configure the Datadog Java Agent with WSO2 Identity Server, follow these steps:
-
Install and run the Datadog Agent following the Datadog Agent installation guide.
-
Download the Datadog Java Agent (
dd-java-agent.jar) from the Datadog releases page. -
To enable tracing, add the agent and related configurations as Java options when starting WSO2 Identity Server. To do so,
-
Open the corresponding to your operating system.
<IS_HOME>/bin/wso2server.sh<IS_HOME>/bin/wso2server.bat -
Extend the
JAVA_OPTSvariable to include the Java agent option.
-
-
In the same file, add the required system properties as Java options to define service metadata and agent settings specific to the environment. For example:
-Ddd.service="wso2is" \
-Ddd.env="dev" \
-Ddd.version=1.0 \
-Ddd.logs.injection=true \
-Ddd.trace.agent.host=localhost \
-Ddd.trace.otel.enabled=true \
Refer to the Datadog Java Agent configuration documentation for the full set of options.
-
Restart WSO2 Identity Server and confirm that traces appear in the Datadog APM dashboard.
Enable LDAP tracing in WSO2 Identity Server
WSO2 Identity Server extends the Datadog Java Agent with OpenTelemetry-based LDAP instrumentation, capturing operations such as search, bind, and lookup for full tracing alongside API and database calls.
Note
This feature is disabled by default to avoid any potential performance impact.
You can enter the following configuration in the <IS_HOME>/repository/conf/deployment.toml file to enable LDAP tracing.
| Configuration Parameter | Description |
|---|---|
ldap.enabled |
Enables OpenTelemetry-based tracing for LDAP operations. When set to true, WSO2 Identity Server instruments LDAP interactions such as search, bind, and lookup. The default value equals false. |
ldap.scope_name |
Defines the OpenTelemetry instrumentation scope name for LDAP spans. The default value equals "wso2isldap". |
When enabled, LDAP operations produce spans that include metadata such as operation type, base or target DN, search filters, execution duration, and error status where applicable. The configured Java agent exports these spans to the observability platform. The following example shows a sample span for the ldap.search operation (from Datadog).
{
  "ldap": {
    "filter": "(&(objectClass=***)(member=uid=***,ou=***,dc=***,dc=***))",
    "search": {
      "controls": "{scope=2, countLimit=0, timeLimit=0, returningAttributes=[cn], derefLinkFlag=false, returningObjFlag=false}"
    },
    "success": "true",
    "dn": "ou=***,dc=***,dc=***"
  },
  "peer": {
    "hostname": "localhost",
    "port": 10390,
    "service": "ldap"
  },
  "correlation_id": "8787f3ba-6149-4aa7-a620-77889664bae3",
  "language": "java",
  "thread": {
    "name": "https-jsse-nio-9443-exec-9",
    "id": 244
  },
  "env": "dev",
  "version": "1.0",
  "span": {
    "kind": "client"
  },
  "duration": 1211208
}