Access the ELK Analytics Dashboard
Once you have setup ELK analytics dashboards, follow the guide below to learn how to access the analytics dashboard.
-
Access Kibana using the following URL:
http://{KIBANA_HOST}:5601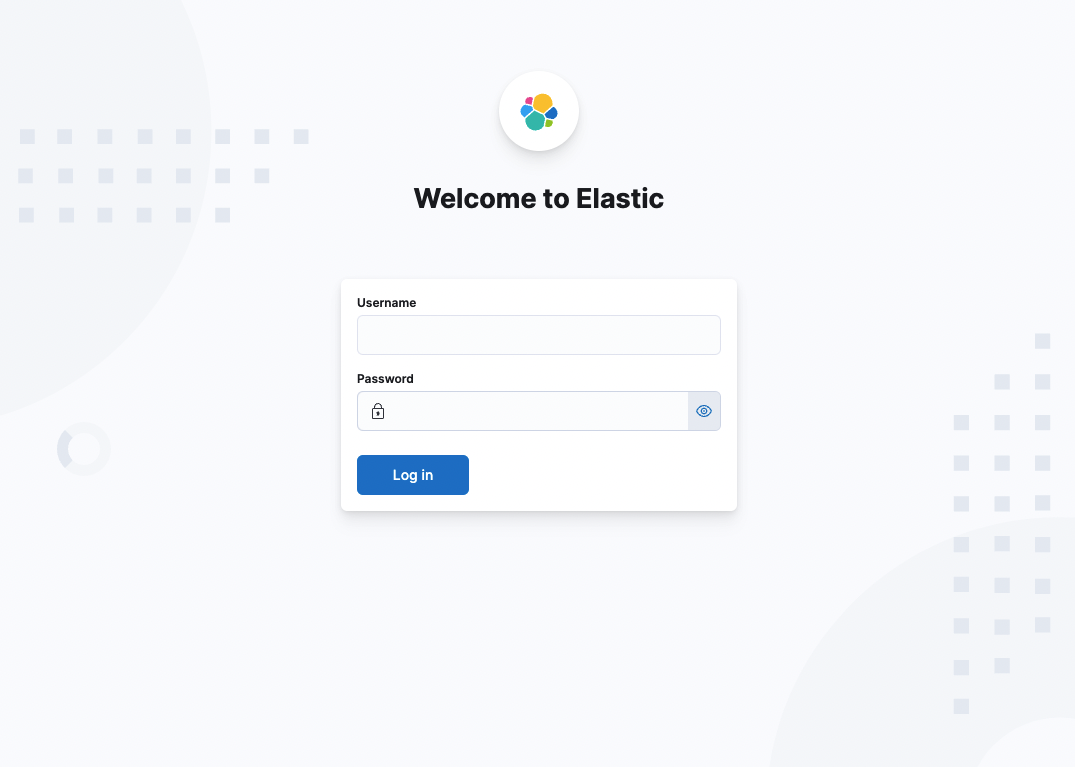
-
You can login to Kibana with the default
elasticuser or refer to the elastic documentation and learn how to create a new user. -
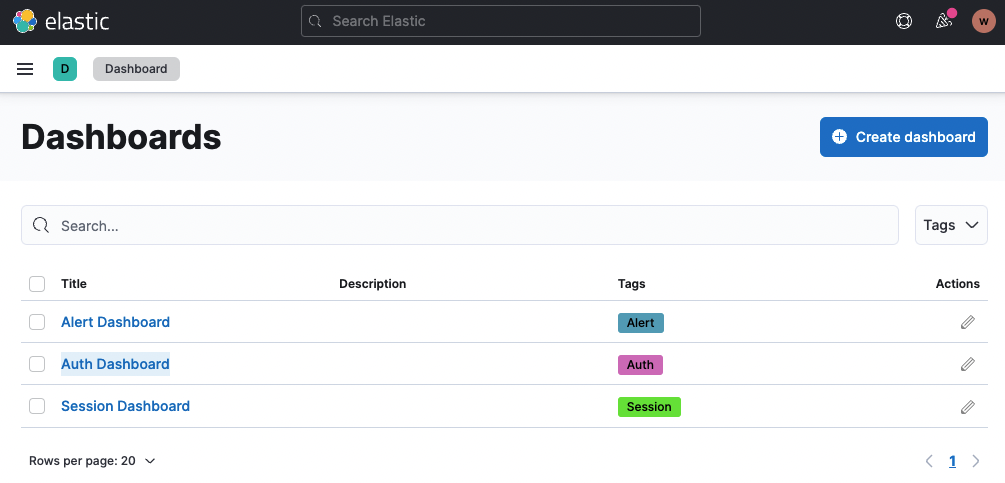
On the left panel, navigate to Analytics > Dashboard and click on Auth Dashboard.
-
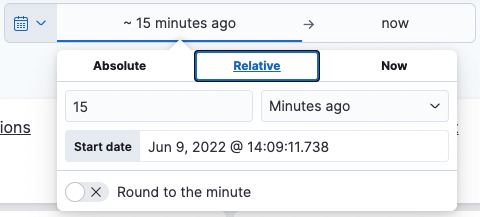
Use the filter to set the time range in which to view the statistics and click Update.
-
To synchronize analytics automatically:
- Click the calendar icon in the time range filter.
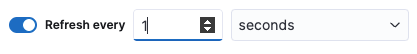
- Toggle Refresh every at the bottom of the dropdown.
-
Set your desired time interval.
-
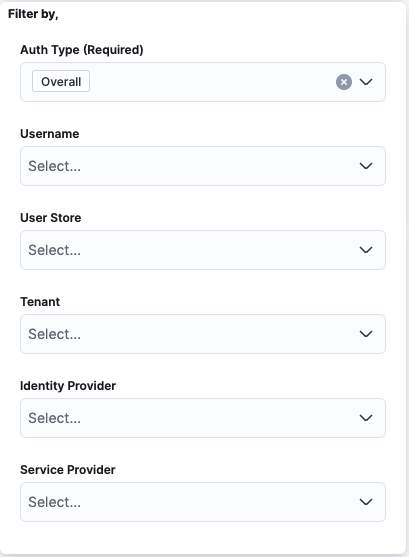
You can use the following filters to narrow down your analytics further.
What's Next?
Explore the following topics: