Analyzing Overall Login Attempts
The Overall Login Attempts statistical visualization displays statistics relating to overall authentication activities carried out by WSO2 Identity Server.
An overall authentication encompasses a sequence of authentication steps. In order for an overall authentication to be considered as successful, all its constituent steps shoudl be successful. A failure of even a single step within the sequence causes the overall authentication to be marked as a failure.
The statistics displayed in this page include:
- The overall success and failure rate for login attempts over time
- The login attempts filtered based on service providers and users
Follow the steps below to view the Overall statistical visualization.
Tip
Before you begin
- Access the WSO2 IS Analytics Dashboard. For more information, see Accessing the Analytics Dashboard.
- Perform either of the following.
- Click SEE MORE in the Overall Login Attempts Summary tile.
- Click menu icon > Overall.
Let's analyze the overall authentication activities with the following widgets.
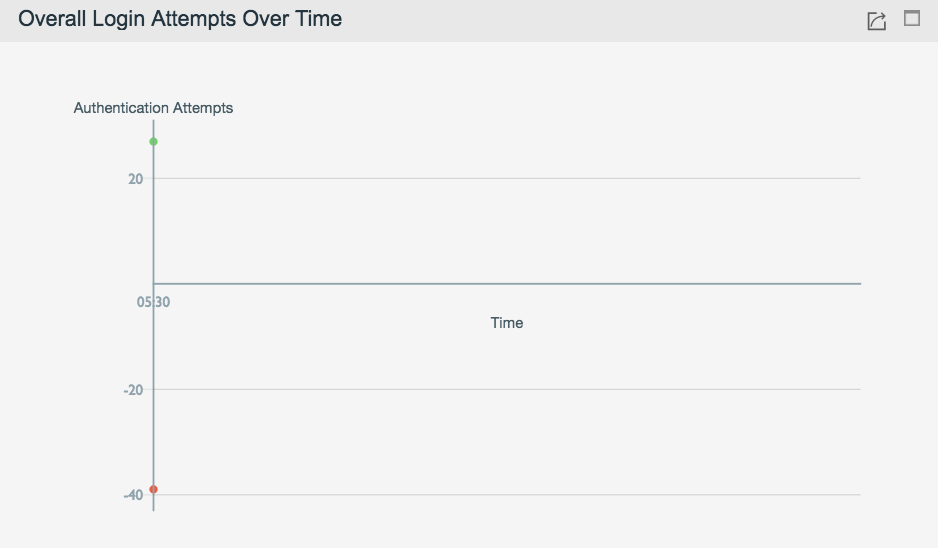
Overall Login Attempts Over Time
Description
This chart presents the total number of login attempts that are made during the selected time interval.
Purpose
This chart allows deriving the login patterns and detect deviations that may due to unusual occurrences such as attacks, system downtime, etc.
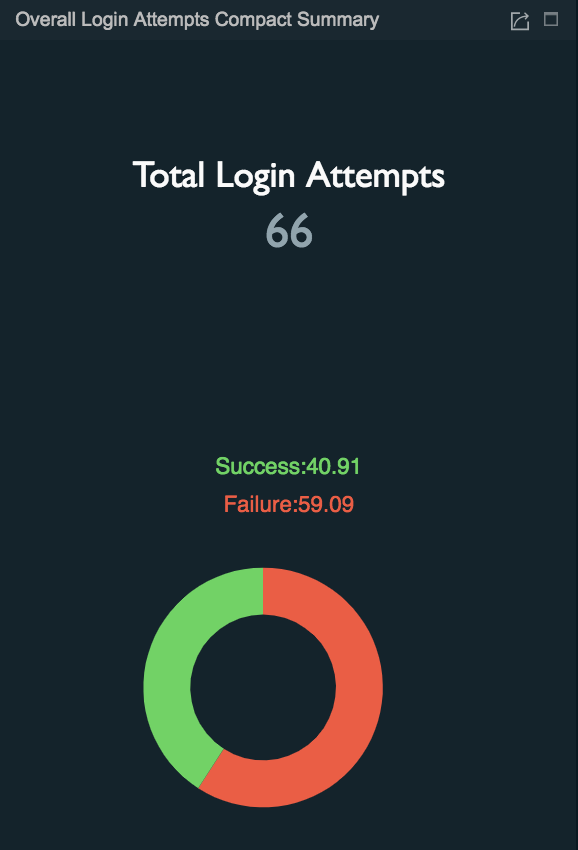
Compact Summary of Overall Login Attempts
Description
This chart presents a summary of the overall login attempts.
Purpose
This chart allows identifying the percentages of the successful and failed login attempts.
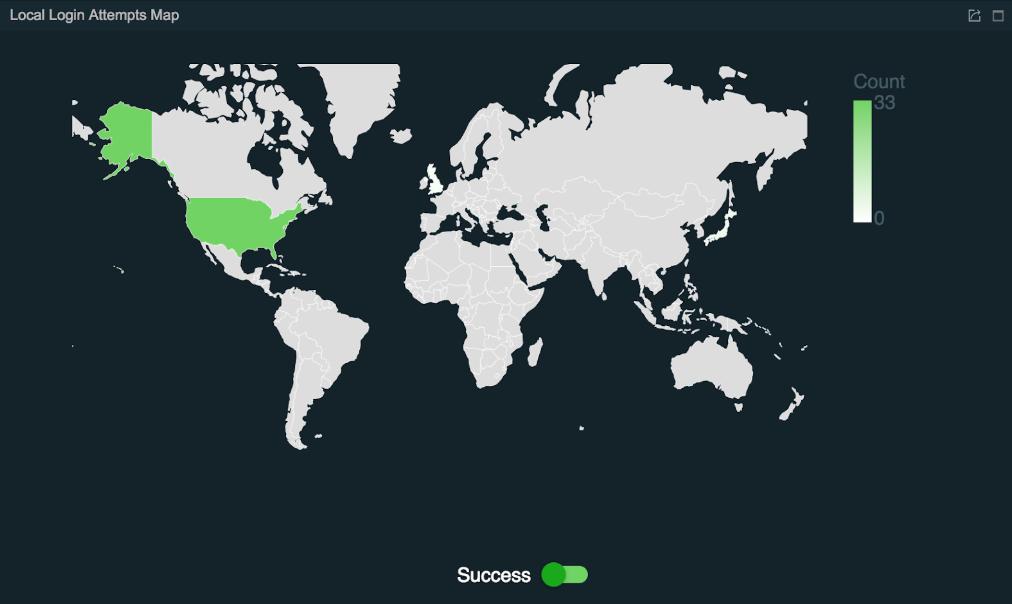
Map View of Overall Login Attempts
Description
This chart presents the login attempts in a map view based on the IP addresses.
Note
In order for this widget to work, configure the gel location database. For more information, see Enabling Geolocation Based Statistics.
Purpose
- This chart allows viewing the countries from which the logins were attempted.
- The color intensity indicates the number of login attempts, e.g., an area in darker green indicates more login attempts when compared to an area in lighter green.
- The toggle key helps to switch from the success view and failure view.
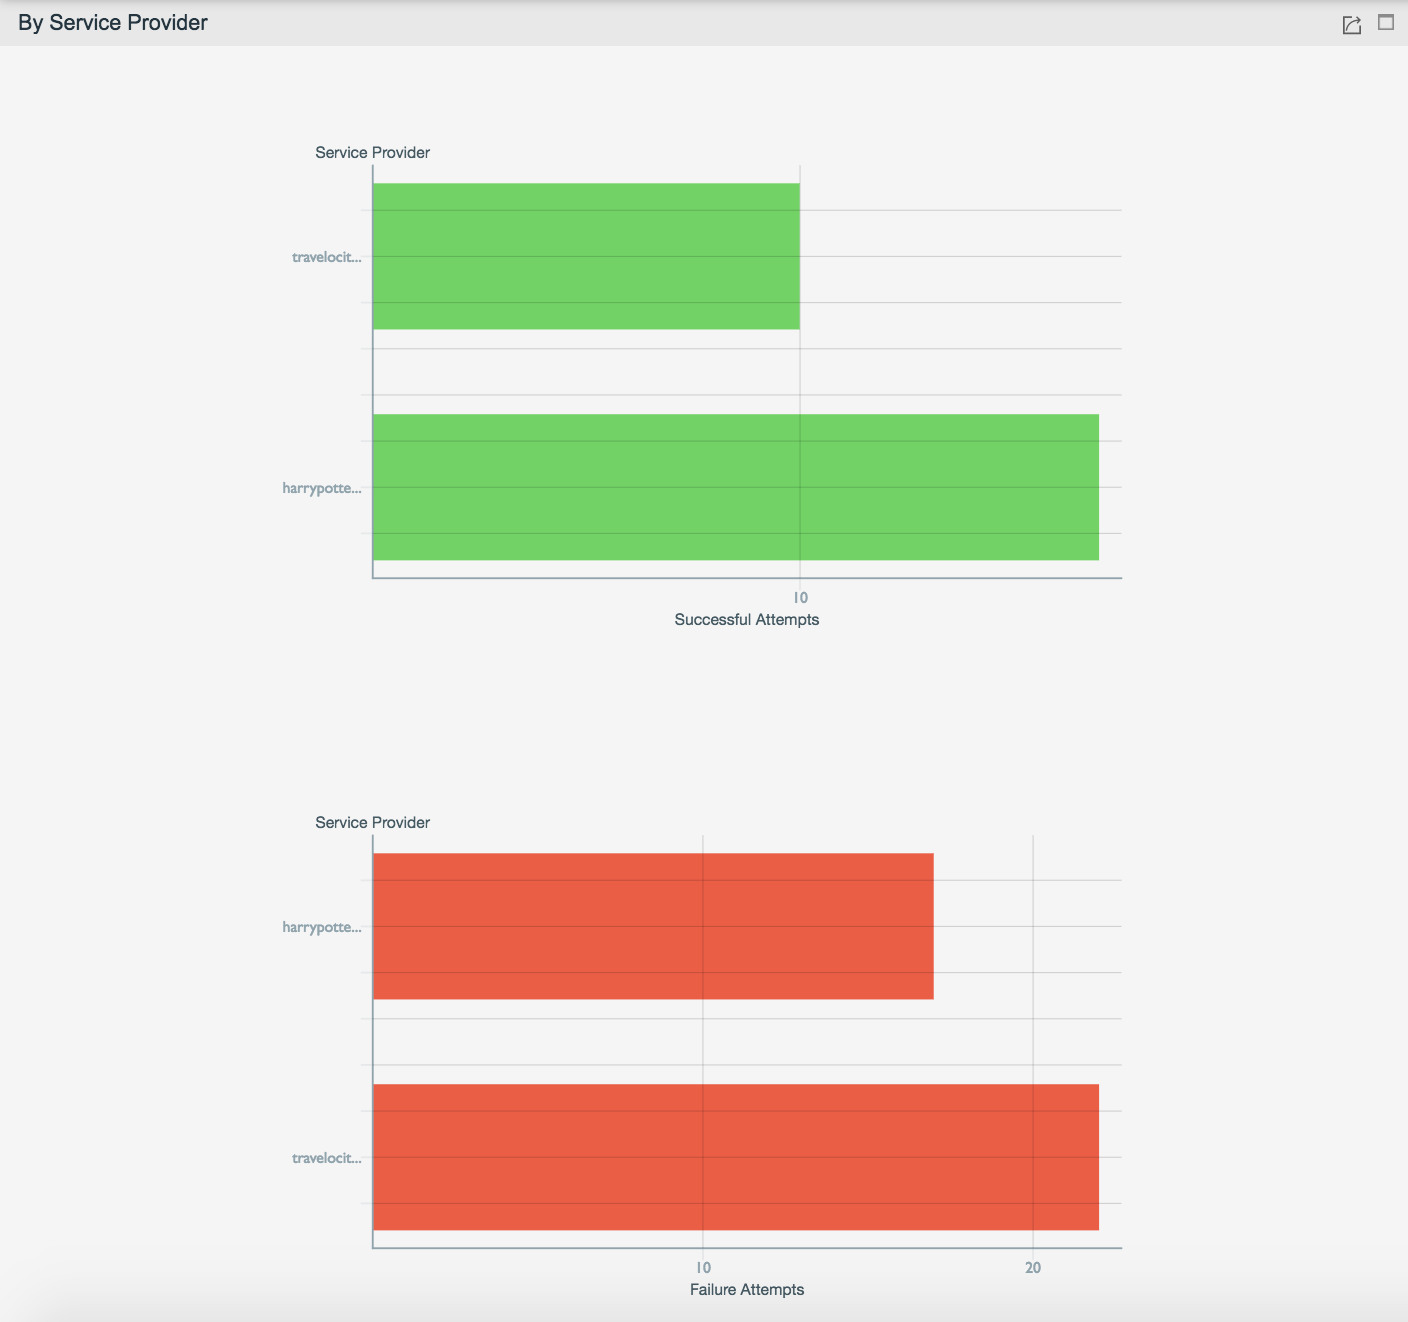
Details Of Login Attempts By Service Provider
Description
- This chart presents the successful and failed login attempts sorted by service provider.
- Pagination is available if the statistics involve more than ten service providers.
Purpose
This chart allows viewing the login attempts sorted based on the service providers.
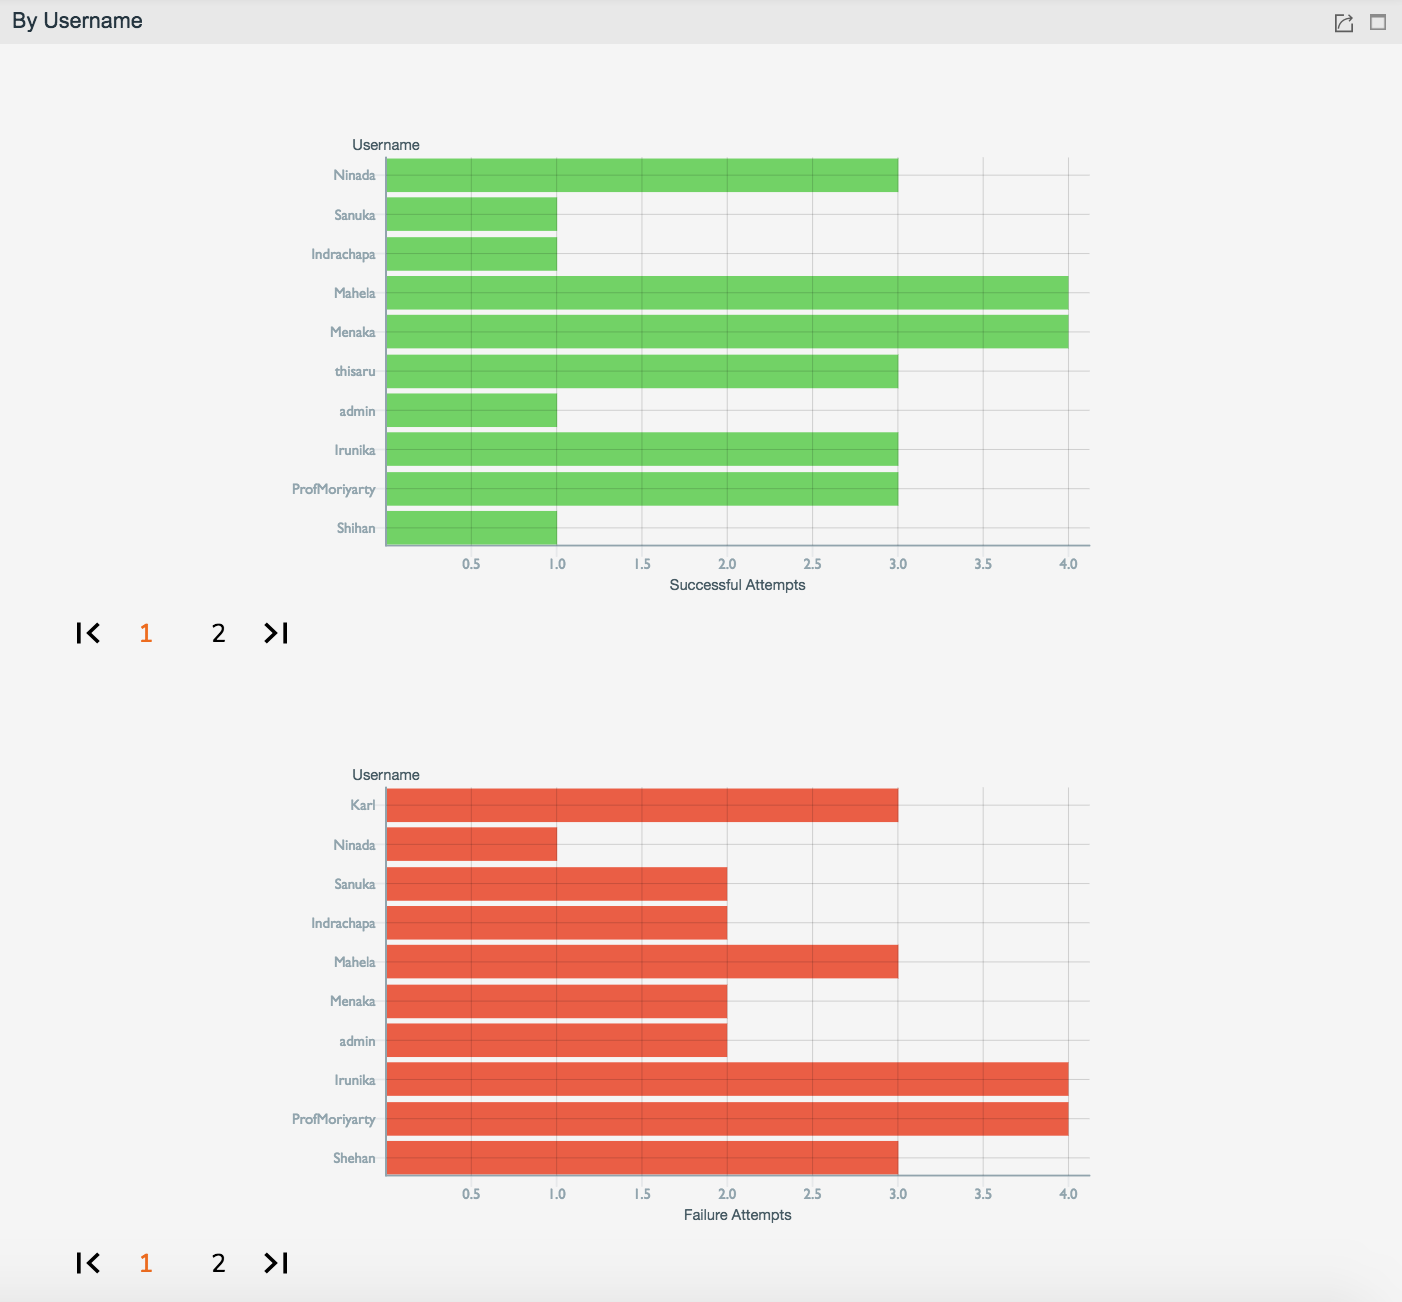
Details Of Login Attempts By User
Description
- This chart presents the successful and failed login attempts sorted by users.
- Pagination is available if the statistics involve more than ten users.
Purpose
This chart allows viewing the login attempts sorted based on the user names.
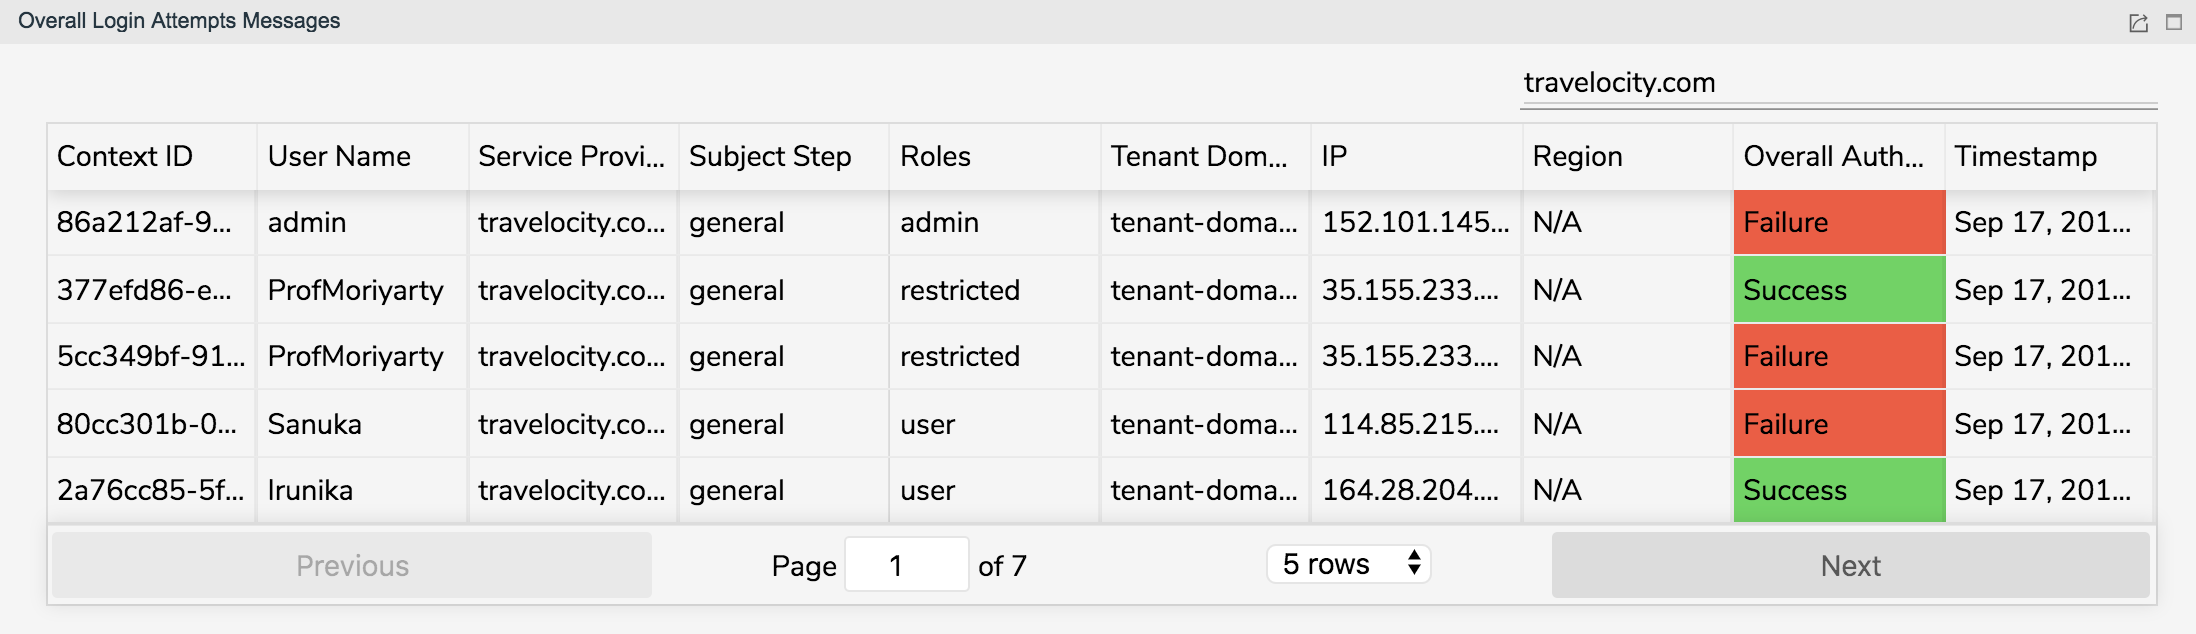
Full Details Of Each Login Attempt
Description
- This widget presents details of each login attempt including the context ID, user name, service provider, subject step, roles, tenant domain, IP, region, whether the overall authentication was successful or not, and the time stamp.
- The login attempts can be sorted in the ascending/descending order by the fields in the table if required.
Purpose
This widget allows view the details of each login attempt.