Configure ELK Alerts
The following guide shows you how to configure alerts in ELK.
Prerequisite
Configure ELK Analytics in WSO2 Identity Server.
Create Elasticsearch Transforms
Elasticsearch transforms are used to capture the alert events from the raw event data. Learn more about transforms in the elastic documentation.
-
Execute the following cURL commands to create the ELK transforms.
-
Long session alert
Info
Replace {ELASTICSEARCH_HOST}, {ELASTICSEARCH_BASIC_AUTH_HEADER}, {PERCENTAGE}, and {DURATION} to match your settings
Request Format
Sample Requestcurl -L -X PUT 'https://{ELASTICSEARCH_HOST}/_transform/wso2-iam-alert-long-session' -H 'Authorization: Basic {ELASTICSEARCH_BASIC_AUTH_HEADER}' -H 'Content-Type: application/json' --data-raw '{"source":{"index":["wso2-iam-session-raw*"],"runtime_mappings":{"time_elapsed":{"type":"long","script":"def retval = 0;def current_time = new Date().getTime(); def termination = doc['\''event.payloadData.terminationTimestamp'\''].value; def start = doc['\''event.payloadData.startTimestamp'\''].value; def action = doc['\''event.payloadData.action'\''].value; if (current_time > termination || action == 0) {retval = (termination - start) / (1000 * 60);} else if (action == 1 || action == 2){retval = (current_time - start) / (1000 * 60);} emit(retval);"},"isActive":{"type":"long","script":"def current_time = new Date().getTime();if(doc['\''event.payloadData.terminationTimestamp'\''].value > current_time){emit(1);} else {emit(0);}"}},"query":{"bool":{"must":[{"range":{"@timestamp":{"gte":"now-7d"}}},{"match":{"event.payloadData.rememberMeFlag":true}}]}}},"dest":{"index":"wso2-iam-alert-session"},"sync":{"time":{"field":"@timestamp","delay":"60s"}},"pivot":{"group_by":{"username":{"terms":{"field":"event.payloadData.username.keyword"}},"tenant_domain":{"terms":{"field":"event.payloadData.tenantDomain.keyword"}}},"aggregations":{"latest_session":{"top_metrics":{"metrics":[{"field":"time_elapsed"}],"sort":{"@timestamp":"desc"}}},"active":{"top_metrics":{"metrics":[{"field":"isActive"}],"sort":{"isActive":"desc"}}},"latest_timestamp":{"top_metrics":{"metrics":[{"field":"@timestamp"}],"sort":{"@timestamp":"desc"}}},"time_elapsed_avg":{"avg":{"field":"time_elapsed"}},"is_long":{"bucket_script":{"buckets_path":{"duration_avg":"time_elapsed_avg","duration":"latest_session.time_elapsed","active_status":"active.isActive"},"script":"if((params.duration > (params.duration_avg * {PERCENTAGE} / 100) || params.duration > {DURATION}) && params.active_status == 1) return 1; else return 0;"}}}}}'Responsecurl -L -X PUT 'https://localhost:9200/_transform/wso2-iam-alert-long-session' -H 'Authorization: Basic d3NvMnVzZXI6Y2hhbmdlbWU=' -H 'Content-Type: application/json' --data-raw '{"source":{"index":["wso2-iam-session-raw*"],"runtime_mappings":{"time_elapsed":{"type":"long","script":"def retval = 0;def current_time = new Date().getTime(); def termination = doc['\''event.payloadData.terminationTimestamp'\''].value; def start = doc['\''event.payloadData.startTimestamp'\''].value; def action = doc['\''event.payloadData.action'\''].value; if (current_time > termination || action == 0) {retval = (termination - start) / (1000 * 60);} else if (action == 1 || action == 2){retval = (current_time - start) / (1000 * 60);} emit(retval);"},"isActive":{"type":"long","script":"def current_time = new Date().getTime();if(doc['\''event.payloadData.terminationTimestamp'\''].value > current_time){emit(1);} else {emit(0);}"}},"query":{"bool":{"must":[{"range":{"@timestamp":{"gte":"now-7d"}}},{"match":{"event.payloadData.rememberMeFlag":true}}]}}},"dest":{"index":"wso2-iam-alert-session"},"sync":{"time":{"field":"@timestamp","delay":"60s"}},"pivot":{"group_by":{"username":{"terms":{"field":"event.payloadData.username.keyword"}},"tenant_domain":{"terms":{"field":"event.payloadData.tenantDomain.keyword"}}},"aggregations":{"latest_session":{"top_metrics":{"metrics":[{"field":"time_elapsed"}],"sort":{"@timestamp":"desc"}}},"active":{"top_metrics":{"metrics":[{"field":"isActive"}],"sort":{"isActive":"desc"}}},"latest_timestamp":{"top_metrics":{"metrics":[{"field":"@timestamp"}],"sort":{"@timestamp":"desc"}}},"time_elapsed_avg":{"avg":{"field":"time_elapsed"}},"is_long":{"bucket_script":{"buckets_path":{"duration_avg":"time_elapsed_avg","duration":"latest_session.time_elapsed","active_status":"active.isActive"},"script":"if((params.duration > (params.duration_avg * 150 / 100) || params.duration > 15) && params.active_status == 1) return 1; else return 0;"}}}}}'{"acknowledged": true} -
Suspicious login alert
Info
Replace {ELASTICSEARCH_HOST}, {ELASTICSEARCH_BASIC_AUTH_HEADER}, {SUCCESS_COUNT}, and {FAILURE_COUNT} to match your settings.
Request Format
Sample Requestcurl -L -X PUT 'https://{ELASTICSEARCH_HOST}/_transform/wso2-iam-alert-suspicious-login' -H 'Authorization: Basic {ELASTICSEARCH_BASIC_AUTH_HEADER}' -H 'Content-Type: application/json' --data-raw '{"source":{"index":["wso2-iam-auth-raw*"]},"dest":{"index":"wso2-iam-alert-auth"},"sync":{"time":{"field":"@timestamp","delay":"60s"}},"pivot":{"group_by":{"event.payloadData.username":{"terms":{"field":"event.payloadData.username.keyword"}},"event.payloadData.tenantDomain":{"terms":{"field":"event.payloadData.tenantDomain.keyword"}},"event.payloadData.userStoreDomain":{"terms":{"field":"event.payloadData.userStoreDomain.keyword"}},"@timestamp":{"date_histogram":{"field":"@timestamp","fixed_interval":"5m"}}},"aggregations":{"filter_success":{"filter":{"bool":{"must":[{"match":{"event.payloadData.authStepSuccess":true}}]}}},"filter_failed":{"filter":{"bool":{"must":[{"match":{"event.payloadData.authStepSuccess":false}}]}}},"is_sus":{"bucket_script":{"buckets_path":{"failed":"filter_failed._count","success":"filter_success._count"},"script":"if(params.success >= {SUCCESS_COUNT} && params.failed >= {FAILURE_COUNT} && params.failed > params.success) return 1; else return 0;"}}}}}'Responsecurl -L -X PUT 'https://localhost:9200/_transform/wso2-iam-alert-suspicious-login' -H 'Authorization: Basic d3NvMnVzZXI6Y2hhbmdlbWU=' -H 'Content-Type: application/json' --data-raw '{"source":{"index":["wso2-iam-auth-raw*"]},"dest":{"index":"wso2-iam-alert-auth"},"sync":{"time":{"field":"@timestamp","delay":"60s"}},"pivot":{"group_by":{"event.payloadData.username":{"terms":{"field":"event.payloadData.username.keyword"}},"event.payloadData.tenantDomain":{"terms":{"field":"event.payloadData.tenantDomain.keyword"}},"event.payloadData.userStoreDomain":{"terms":{"field":"event.payloadData.userStoreDomain.keyword"}},"@timestamp":{"date_histogram":{"field":"@timestamp","fixed_interval":"5m"}}},"aggregations":{"filter_success":{"filter":{"bool":{"must":[{"match":{"event.payloadData.authStepSuccess":true}}]}}},"filter_failed":{"filter":{"bool":{"must":[{"match":{"event.payloadData.authStepSuccess":false}}]}}},"is_sus":{"bucket_script":{"buckets_path":{"failed":"filter_failed._count","success":"filter_success._count"},"script":"if(params.success >= 1 && params.failed >= 2 && params.failed > params.success) return 1; else return 0;"}}}}}'{"acknowledged": true}
-
-
Login to Kibana as an administrator and navigate to Stack Management > Transforms to view the newly created transforms named wso2-iam-alert-suspicious-login and wso2-iam-alert-long-session.
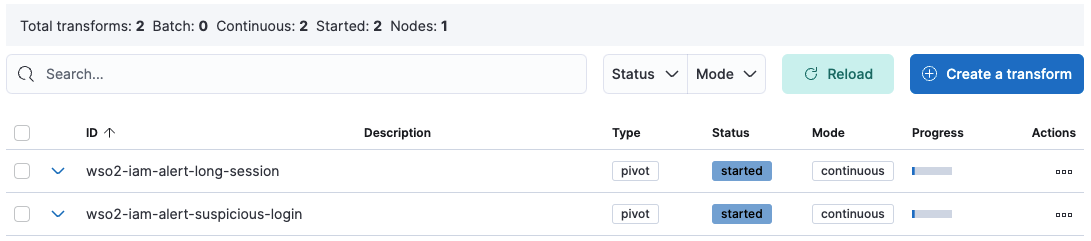
-
For both transforms, click the icon under Actions and click Start.
Configure Alert Dashboards
Alert dashboards display long sessions and suspicious login alerts. Follow the steps below to configure the ELK Alert Dashboard.
- Generate encryption keys for Kibana using the following command.
<KIBANA_HOME>/bin/kibana-encryption-keys generate - Navigate to the Kibana directory and open the kibana.yml file found at
/config . - Copy the generated keys and paste them at the bottom of the kibana.yml file.
- Restart Kibana.
- Download the following file.
- Log in to Kibana and navigate to Stack Management > Saved Objects.
- Click Import, add the downloaded file as an import object, and import.
- Navigate to the Dashboard section to view the created Alert Dashboard.
Configure Alert Connectors
Alert Connectors can be used to receive notifications for the events that can be viewed from the Alert Dashboard.
Connectors
- Email : Send an email from your server.
- IBM Resilient : Create an incident in IBM Resilient.
- Index : Index data into Elasticsearch.
- Jira : Create an incident in Jira.
- Microsoft Teams : Send a message to a Microsoft Teams channel.
- PagerDuty : Send an event in PagerDuty.
- ServerLog : Add a message to a Kibana log.
- ServiceNow ITSM : Create an incident in ServiceNow.
- ServiceNow SecOps : Create a security incident in ServiceNow.
- ServiceNow ITOM : Create an event in ServiceNow.
- Slack :Send a message to a Slack channel or user.
- Swimlane : Create an incident in Swimlane.
- Webhook : Send a request to a web service.
Follow the steps below to configure alert connectors.
Prerequisite
Follow the Configure Alert Dashboards guide to import the artifact file to Kibana.
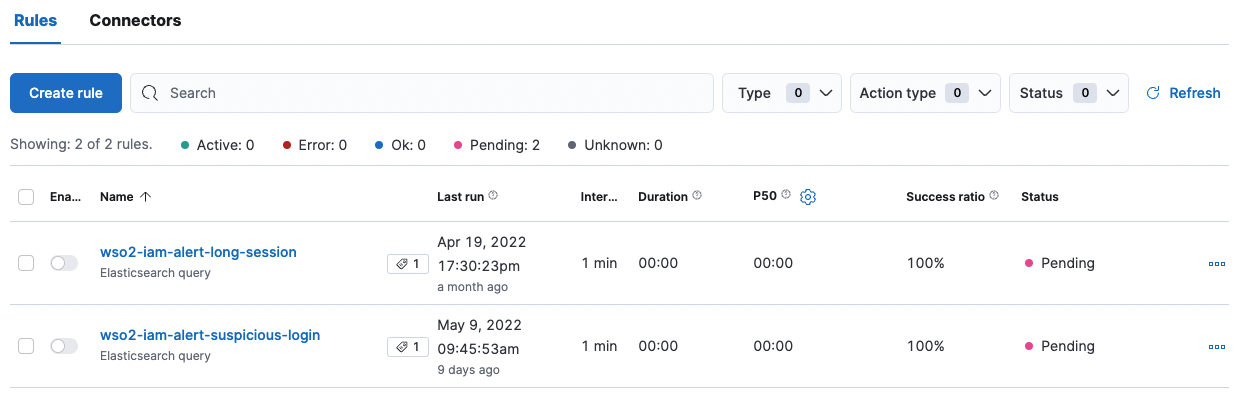
- To view the Alert Rules, go to Stack Management > Rules and Connectors.
- Navigate to the Connectors tab and click Create connector.
- Among the options presented, create your preferred connector type by entering the required details.
- Once created, click on the play icon to test the connection.
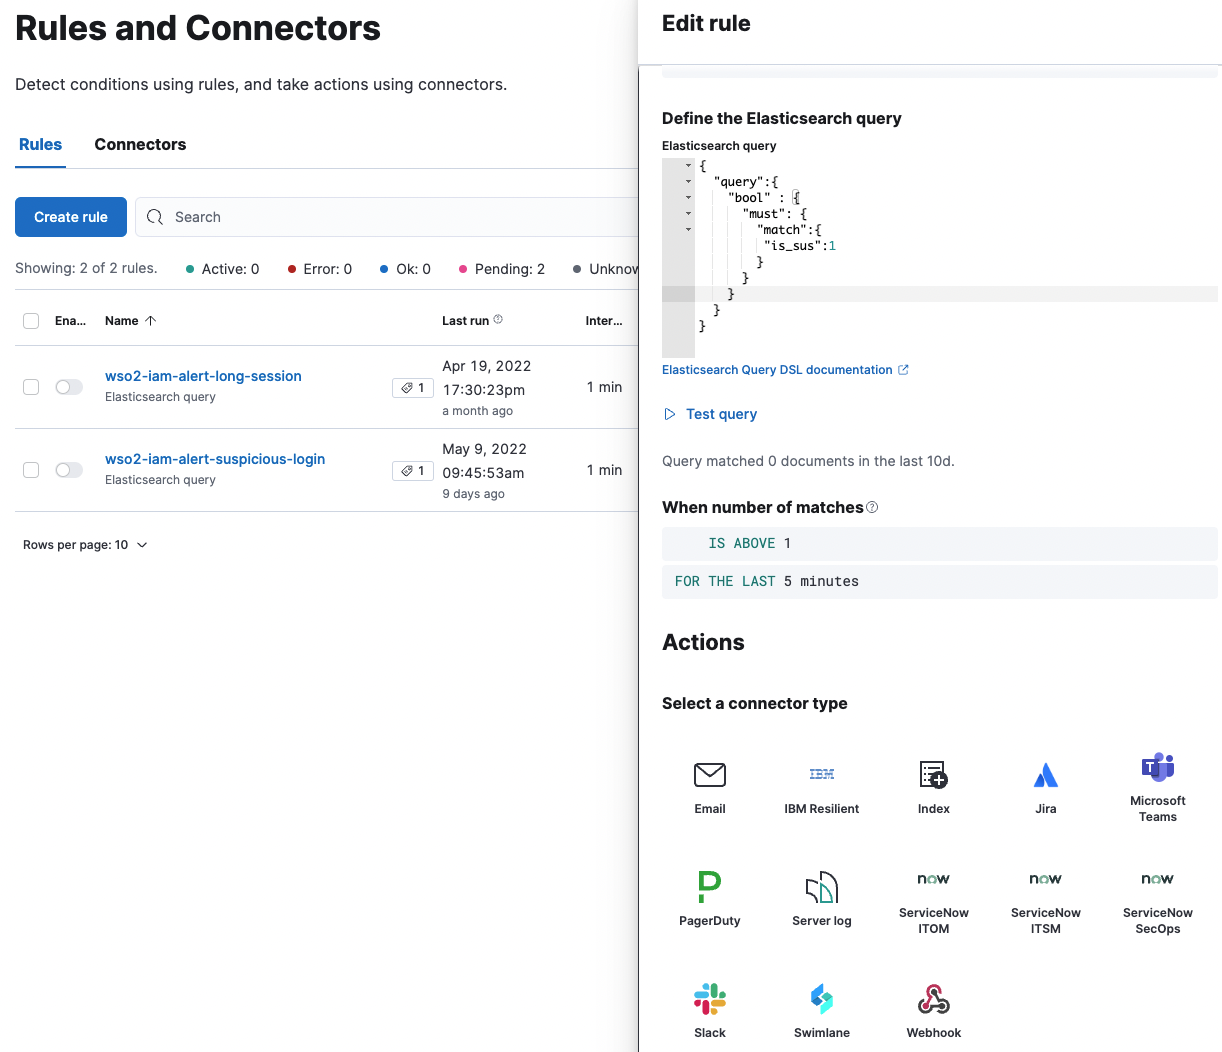
Once you have set your preferred connectors, you need to provide those connectors for each alert rule. To do so:
- Navigate to the Rules tab and click on the Edit icon under a rule.
- Under Actions, provide the connectors that you configured above.
- Change the alert rule and other parameters to your preference and click Save.