Analyzing Session Statistics
The Login Sessions statistical visualization displays statistics relating to the sessions of the different applications that accessed via WSO2 IS.
Follow the steps below to view the Login Sessions.
Tip
Before you begin
- Access the WSO2 IS Analytics Dashboard. For more information, see Accessing the Analytics Dashboard.
- Click menu icon > Login Sessions.
Let's analyze the login sessions with the following widgets.
Active Sessions
Description
This widget presents the currently active sessions and gets updated for each event that is coming from WSO2 IS.
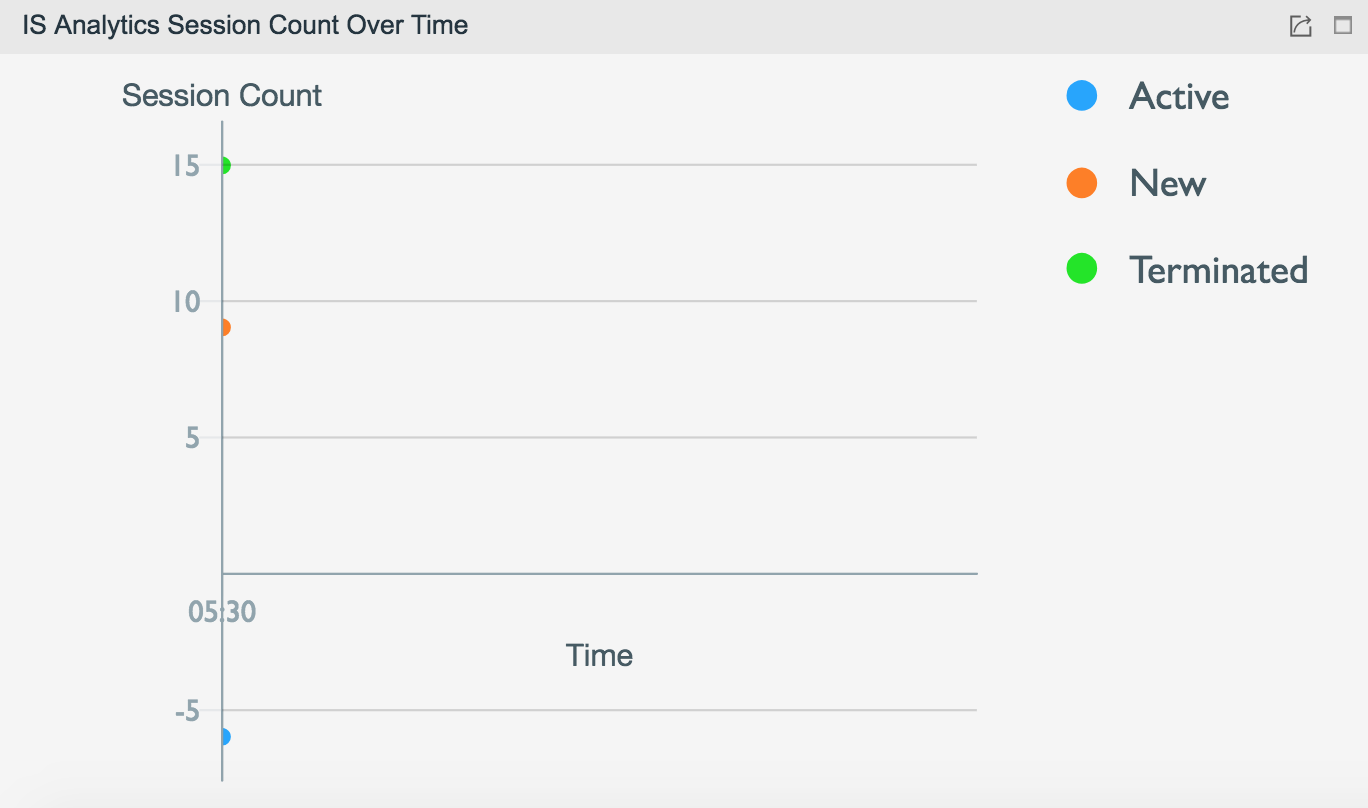
Session Count Over Time
Description
- This chart presents the session count over time.
- The Active line indicates the number of active sessions over the selected time interval. A session needs to be active at the end of the selected time bucket in order to be counted as an active session.
-
The New line indicates the number of sessions that were started during the selected time interval.
-
The Terminated line indicates the number of terminated sessions over the given time interval.
Purpose
This chart allows,
-
Understanding the current load that is handled by your application in terms of the number of active sessions at any given time.
-
Understanding the load handled by your application in terms of the number of sessions over any selected time interval.
-
Compare the load handled in terms of the number of sessions over different time intervals to identify patterns relating to the usage of your applications.
Recommended Actions
Select different time intervals to identify the correlations between the usage of an application and time.
When you identify the specific time intervals, e.g., specific times of the day, specific days of the week, etc., where the usage of an application is particularly high, you can allocate more resources to handle the increased load. Similarly, you can allocate less resources during time intervals when the load is relatively low.
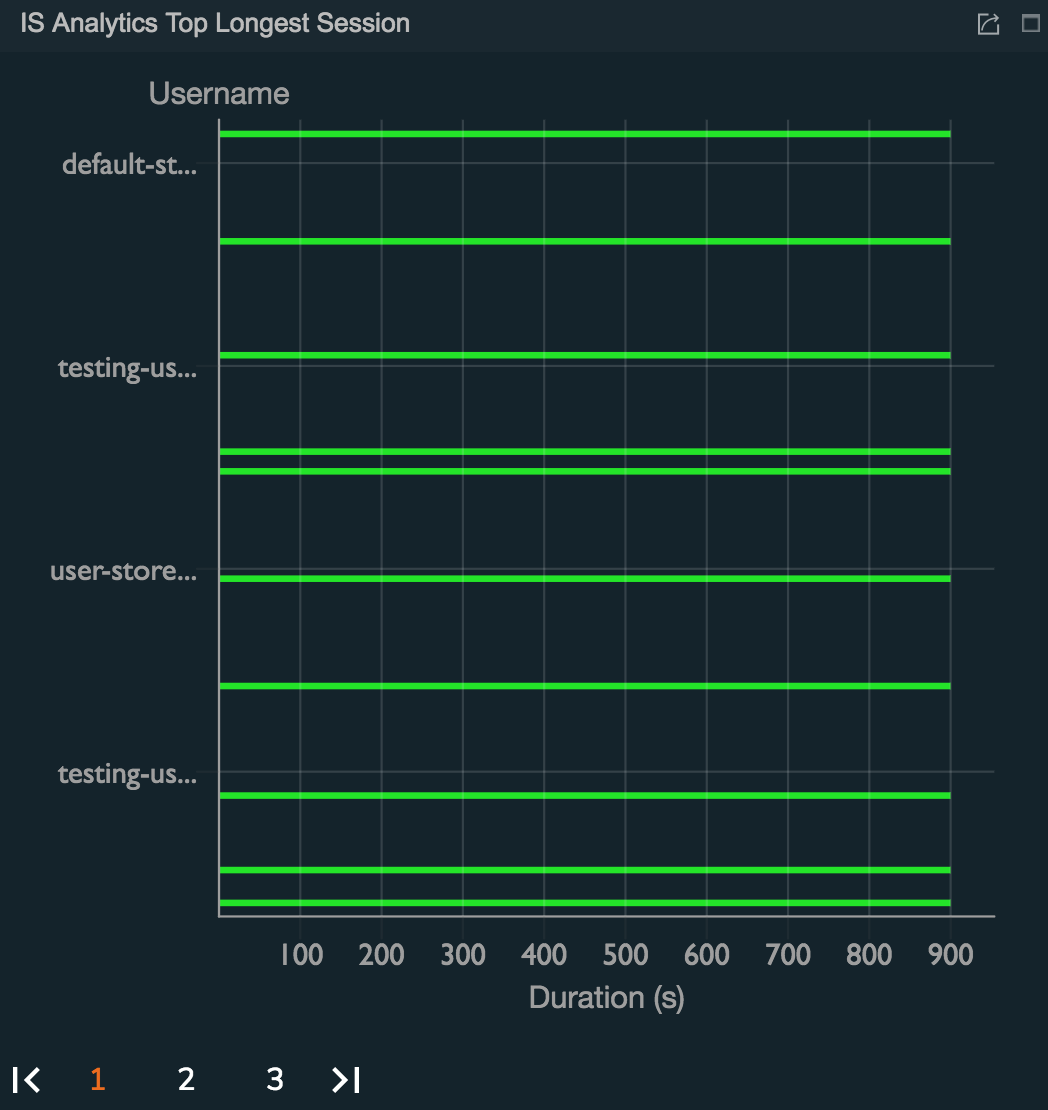
Top Longest Session
Description
This chart presents the longest sessions that took place during a given time interval by the length of the session. The time duration for each session is displayed.
Purpose
-
This chart allows identifying the longest session of each user with the respective length of duration.
-
Compare the top longest sessions for different time intervals enables to identify the users who are most active during different time intervals.
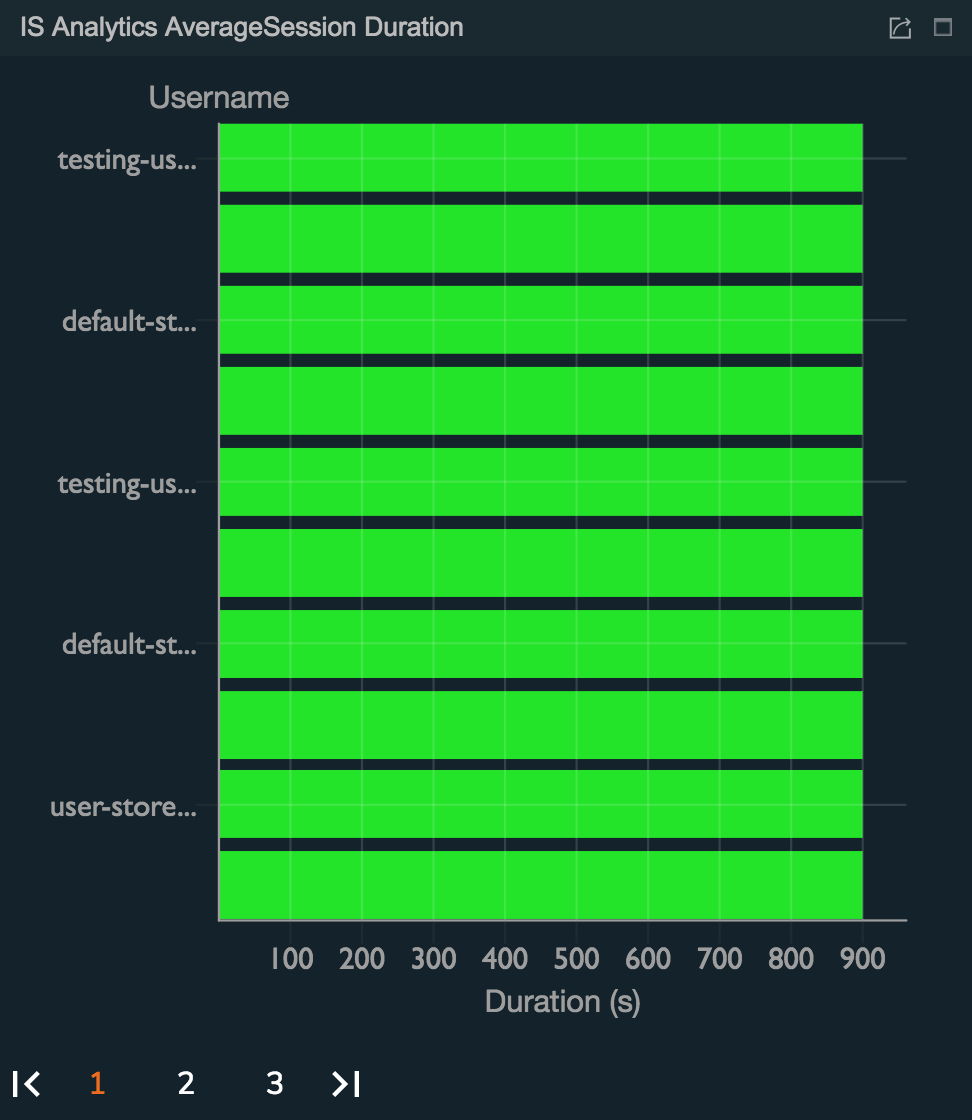
Average Session Duration
Description
This chart presents the average time duration of a session based on the most frequent users for the selected time interval.
Purpose
This chart allows:
-
Understanding the average length of the time spent by each user on a session.
-
Observing changes in the usage patterns for each user by viewing the average length of time for different time intervals.
Recommended Actions
Compare the average time spent by each user in different time intervals to observe whether the session duration increases or decreases over time.
Once this information is obtained, further investigations can be carried out to identify the reasons for such user behavior and take corrective actions where necessary, e.g., increase/decrease the efficiency of the application and enhance/reduce user experience features that results in users spending more/less time on the application.
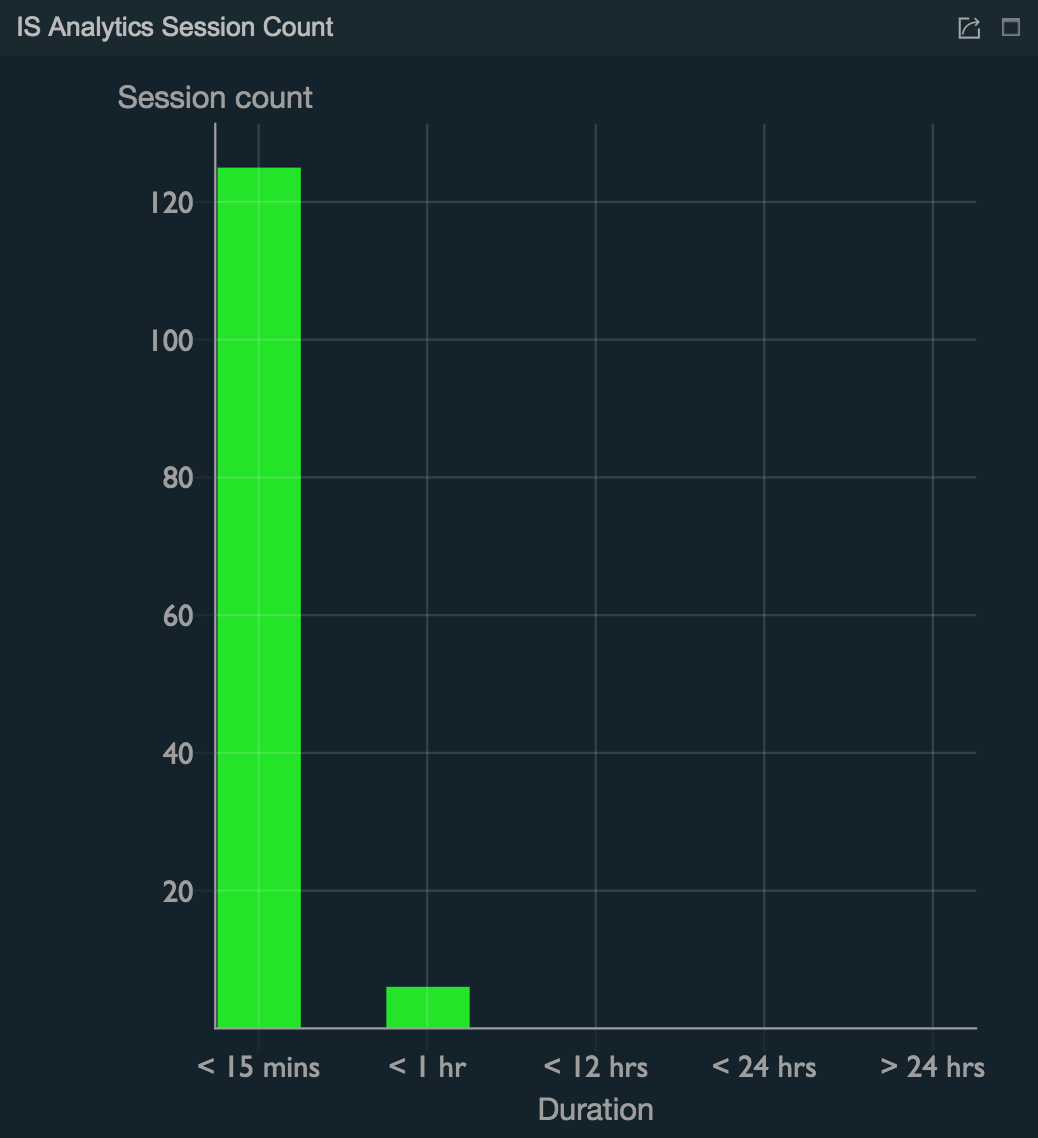
Session Count
Description
This chart groups the sessions by the duration and displays the number of sessions for each group during the given time interval.
Purpose
This allows:
-
Observing the count for different session groups and identifying the general user behavior for your application in terms of the session duration.
-
Identifying changes to the user behavior pattern in terms of the time spent on a session over different time intervals.
Recommended Actions
Compare the session counts for different groups at different time intervals to observe changes in patterns relating to session length. Subsequently, investigate further to understand the reasons for these changes and take necessary steps, e.g., increase/decrease the efficiency of the application and enhance/reduce user experience features that results in users spending more/less time on the application.
Detail View
Description
This widget presents details of each session including
-
Username of the user who carried out the session
-
The session start time
-
The session end time, i.e., the time the session actually terminated, due to logout event or forceful termination
-
The session termination time, i.e., the time the session is supposed to terminate
-
The duration of the session
-
Whether the session is currently active or not
-
The user store domain
-
The IP address of the server
-
The tenant domain
-
Whether the remember me flag is set or not
-
The time stamp
Purpose
This widget allows viewing the details of each individual session.
Top