Working with Product Observability
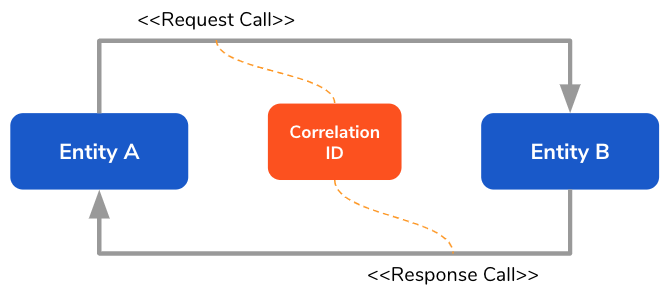
Product observability enables rapid debugging of product issues. WSO2 Identity Server (WSO2 IS) facilitates product observability by logging the time taken for LDAP and JDBC database calls. This helps to track down any latencies caused by database calls in an instance. The request calls and response calls are correlated via a correlation ID that is sent in the request call.

Note
By default, product observability is not enabled as it impacts on the product's performance.
Let's explore the following topics to learn more.
Configuring product observability
log4j configs
Warning
Note that WSO2 Identity Server 5.9.0, 5.10.0, and 5.11.0 are affected by the Log4j2 zero-day vulnerability, which has been reported to WSO2 on 10th December 2021. You can mitigate this vulnerability in your product by following our instructions and guidelines.
Follow the steps below to set up the correlation logs related to the database calls.
- Open the
log4j2.propertiesfile in the<IS_HOME>/repository/confdirectory. -
Append the appender
CORRELATIONto the list of all appenders as follows.
3. Append the logggerappenders = CARBON_CONSOLE, CARBON_LOGFILE, AUDIT_LOGFILE, ATOMIKOS_LOGFILE, CARBON_TRACE_LOGFILE, DELETE_EVENT_LOGFILE, TRANSACTION_LOGFILE, osgi, CORRELATIONcorrelationfor list of all loggers as follows.
4. Following are the default correlation appender configuration. You can change any of these values using the log4j2 .properties.loggers = AUDIT_LOG, trace-messages, org-apache-coyote, com-hazelcast, Owasp-CsrfGuard, org-apache-axis2-wsdl-codegen-writer-PrettyPrinter, org-apache-axis2-clustering, org-apache-catalina, org-apache-tomcat, org-wso2-carbon-apacheds, org-apache-directory-server-ldap, org-apache-directory-server-core-event, com-atomikos, org-quartz, org-apache-jackrabbit-webdav, org-apache-juddi, org-apache-commons-digester-Digester, org-apache-jasper-compiler-TldLocationsCache, org-apache-qpid, org-apache-qpid-server-Main, qpid-message, qpid-message-broker-listening, org-apache-tiles, org-apache-commons-httpclient, org-apache-solr, me-prettyprint-cassandra-hector-TimingLogger, org-apache-axis-enterprise, org-apache-directory-shared-ldap, org-apache-directory-server-ldap-handlers, org-apache-directory-shared-ldap-entry-DefaultServerAttribute, org-apache-directory-server-core-DefaultDirectoryService, org-apache-directory-shared-ldap-ldif-LdifReader, org-apache-directory-server-ldap-LdapProtocolHandler, org-apache-directory-server-core, org-apache-directory-server-ldap-LdapSession, DataNucleus, Datastore, Datastore-Schema, JPOX-Datastore, JPOX-Plugin, JPOX-MetaData, JPOX-Query, JPOX-General, JPOX-Enhancer, org-apache-hadoop-hive, hive, ExecMapper, ExecReducer, net-sf-ehcache, axis2Deployment, equinox, tomcat2, StAXDialectDetector, org-apache-directory-api, org-apache-directory-api-ldap-model-entry, TRANSACTION_LOGGER, DELETE_EVENT_LOGGER, org-springframework, org-opensaml-xml-security-credential-criteria, org-wso2-carbon-user-core, org-wso2-carbon-identity, org-wso2-carbon-identity-sso-saml, correlationappender.CORRELATION.type = RollingFile appender.CORRELATION.name = CORRELATION appender.CORRELATION.fileName =${sys:carbon.home}/repository/logs/correlation.log appender.CORRELATION.filePattern =${sys:carbon.home}/repository/logs/correlation-%d{MM-dd-yyyy}.%i.log appender.CORRELATION.layout.type = PatternLayout appender.CORRELATION.layout.pattern = %d{yyyy-MM-dd HH:mm:ss,SSS}|%X{Correlation-ID}|%t|%mm%n appender.CORRELATION.policies.type = Policies appender.CORRELATION.policies.time.type = TimeBasedTriggeringPolicy appender.CORRELATION.policies.time.interval = 1 appender.CORRELATION.policies.time.modulate = true appender.CORRELATION.policies.size.type = SizeBasedTriggeringPolicy appender.CORRELATION.policies.size.size=10MB appender.CORRELATION.strategy.type = DefaultRolloverStrategy appender.CORRELATION.strategy.max = 20 appender.CORRELATION.filter.threshold.type = ThresholdFilter appender.CORRELATION.filter.threshold.level = INFO
Enabling observability
Follow the steps below to enable product observability.
-
Navigate to the
<IS_HOME>/bindirectory on the command prompt.cd <IS_HOME>/bin -
To set the
-DenableCorrelationLogsproperty totrue, execute the following command.For Mac/Linux --> sh wso2server.sh -DenableCorrelationLogs=true start For Windows --> wso2server.bat -DenableCorrelationLogs=true startNote
By default, this property is set to
false. -
Navigate to the
<IS_HOME>/repository/logsdirectory.cd <IS_HOME>/repository/logsNotice that a separate log file called
correlation.logis created.
Now you are ready to test the product observability of WSO2 IS.
Tip
In order to test product observability, make sure you create a service provider and generate client key and client secret, with which you can perform a secure database call. For more information on creating service providers, see Adding a Service Provider.
Log patterns
Following are the log patterns that support product observability.
JDBC database call logging
timestamp | correlationID | threadID | duration | callType | startTime | methodName | query | connectionUrl 2018-10-22 17:54:46,869|cf57a4a6-3ba7-46aa-8a2b-f02089d0172c|http-nio-9443-exec-2|4|jdbc|1540211086865|executeQuery|SELECT ID, TENANT_ID, IDP_ID, PROVISIONING_CONNECTOR_TYPE, IS_ENABLED, IS_BLOCKING FROM IDP_PROVISIONING_CONFIG WHERE IDP_ID=?|jdbc:mysql://localhost:13306/apimgtdb?autoReconnect=true&useSSL=falseLDAP database call logging
timestamp | correlationID | threadID | duration | callType | startTime | methodName | providerUrl | principal | argsLengeth | args 2018-10-2310:55:02,279|c4eaede8-914d-4712-b630-73f6534b8def|http-nio-9443-exec-18|19|ldap|1540272302260|search|ldap://localhost:10392|uid=admin,ou=system| ou=Users,dc=wso2,dc=org,(&(objectClass=person)(uid=admin)),javax.naming.directory.SearchControls@6359ae3aBeginning of the request call
timestamp | correlationID | threadID | duration | HTTP-In-Request | startTime | methodName | requestQuery | requestPath 2018-11-0514:57:06,757|f884a93d-e3a3-431f-a1ea-f6973e125cb6|http-nio-9443-exec-28|0|HTTP-In-Request|1541410026757|GET|null|/carbon/admin/images/favicon.icoEnding of the request call
timestamp | correlationID | threadID | totalDurationForRequest | HTTP-In-Response | startTime | methodName | requestQuery | requestPath 2018-11-05 14:57:06,764|f884a93d-e3a3-431f-a1ea-f6973e125cb6|http-nio-9443-exec-28|7|HTTP-In-Response|1541410026764|GET|null|/carbon/admin/images/favicon.icoReading the logs
Let's analyze the following sample log lines to find if there are any timing delays for the JDBC or LDAP calls.
|
|
Advanced scenarios
Following are a few advance scenarios that are related to product observability in WSO2 IS.
Denylisting the threads
Certain threads continuously print unnecessary logs. Denylisting prevents the unwanted threads from printing logs thereby improving the readability of the logs.
Follow the steps below to configure thread denylisting.
- Open either of the following files in the
<IS_HOME>/bindirectory on a command prompt.- For Mac/Linux:
wso2server.shfile - For Windows:
wso2server.batfile
- For Mac/Linux:
-
Add the following configuration as a system property.
-Dorg.wso2.CorrelationLogInterceptor.blacklistedThreads=threadName1,threadName2 \Tip
Make sure to add it before the
org.wso2.carbon.bootstrap.Bootstrap $*line.Note
This configuration is not required by default, as all unnecessary threads are already denylisted by the
MessageDeliveryTaskThreadPoolthread. If the above configuration is added, the default value will be overridden. -
Restart the WSO2 IS server.
sh wso2server.sh -DenableCorrelationLogs=true stop sh wso2server.sh -DenableCorrelationLogs=true start -
To send the authentication request, execute the following cURL command.
curl -v -k -X POST --basic -u <CLIENT_KEY>:<CLIENT_SECRET> -H "Content-Type: application/x-www-form-urlencoded;charset=UTF-8" -H "customHeader1:correlationvalue1" -H "customHeader2:correlationvalue2" -d "grant_type=client_credentials" https://localhost:9443/oauth2/tokenTip
Use the
client keyandclient secretof the service provider you created after enabling product observability -
Open the
correlation.logon a command prompt and notice the related logs.tail -f ../repository/logs/correlation.log