System Statistics
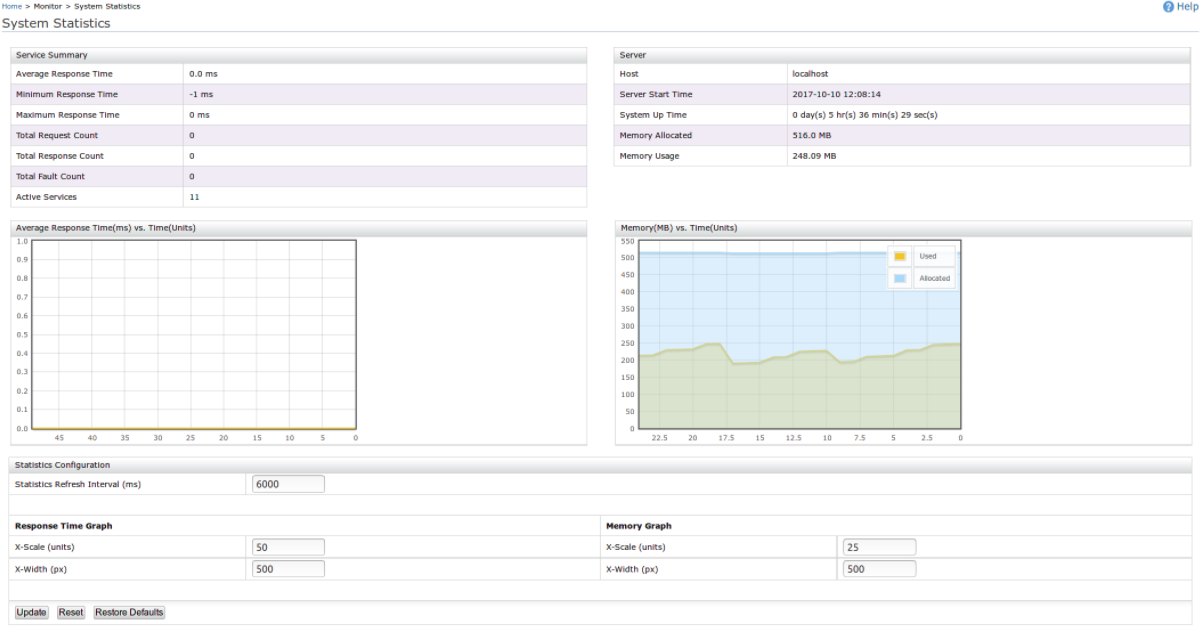
The System Statistics page shows certain statistics related to the WSO2 Identity Server instance. These include free memory, request count, server name, server start time, system up time, active services, total memory, average response time, minimum response time, and maximum response time.
Before you begin
Follow the instructions below to access the system statistics.
-
Sign in. Enter your user name and password to log on to the Management Console.
-
Navigate to the Monitor menu and click on System Statistics. The System Statistics page appears with statistics related to the Identity Server usage.

Service Summary

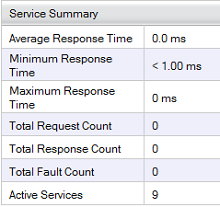
This panel provides the following information:
- Average Response Time - The average amount of time taken by the mediation channel to mediate a message (in milliseconds).
- Minimum Response Time - The least amount of time taken by the mediation channel to mediate a message (in milliseconds).
- Maximum Response Time - The most amount of time taken by the mediation channel to mediate a message (in milliseconds).
- Total Request Count - The total number of messages received and mediated through the mediation channel.
- Total Response Count - The total number of messages sent and mediated through the mediation channel.
- Total Fault Count - The number of messages that triggered faults while being mediated through the channel.
- Active Services - The number of currently active services.
Server information
This panel provides the following information:
- Host - Shows the hostname of the server.
- Server Start Time - Shows the time when the server started.
- System Up Time - Shows the amount of time that the server has been working.
- Memory Allocated - Shows the memory capacity of the server.
- Memory Usage - Shows the memory capacity used by the server.

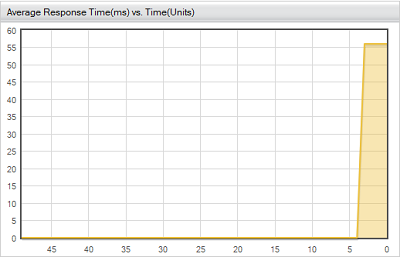
Response Time Graph

This graph shows the temporal variation of the Average Response time.
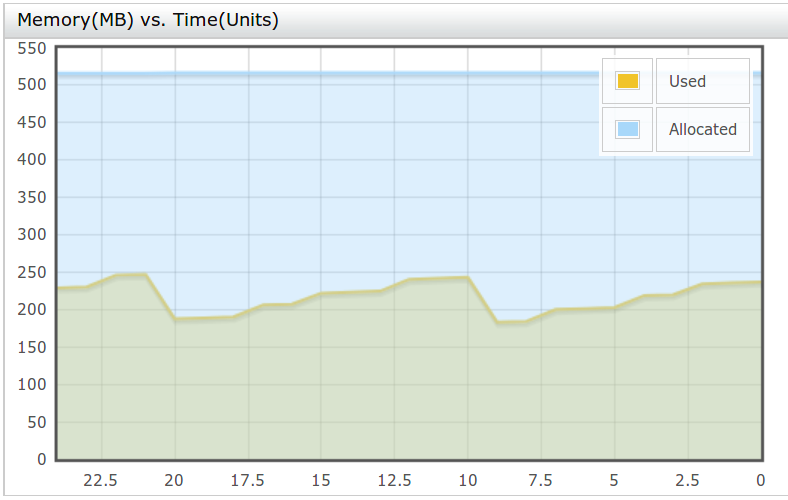
Memory graph
This graph shows a temporal variation of the server memory.

Statistics configuration panel
Use the Statistics Configuration panel to configure the statistics view.
- Enter values into the appropriate fields:
- Statistics Refresh Interval (ms) - Allows you to specify the statistics refresh rate.
- Response Time Graph - Allows you to specify the X and Y
parameters of the Response Time graph.
- X-Scale (units)
- X-Width (px)
- Memory Graph - Allows you to specify the X and Y parameters
of the Memory graph.
- X-Scale (units)
- X-Width (px)
- Click Update.

- Refresh your page.
Info
If you want to restore to the previous values after editing, click Reset.

Info
If you want to restore to the default values, click the corresponding button.
